Women in the 2016 Stack Overflow Survey
By Julia Silge
January 19, 2017
Note: Cross-posted with the Stack Overflow blog
The 2017 Stack Overflow Developer Survey opened last week, and we on the Data Team are looking forward to analyzing the survey results to better understand our developer community. I am particularly interested in women in tech, for probably obvious reasons, and recently I explored last year’s survey data to see what we can learn about women developers.
How many women took the developer survey?
The results from the 2016 Developer Survey are available on GitHub as an R package. For this year, we’ve changed how we ask about gender as we have heard more from our community. Survey respondents can choose more than one option, and the options on the 2017 survey are:
- male,
- female,
- transgender,
- non-binary, genderqueer, or gender non-conforming, and
- a different identity, with an open text field.
We can use the results from last year, with last year’s gender categories, to first just ask how many people of different gender identities took the survey.
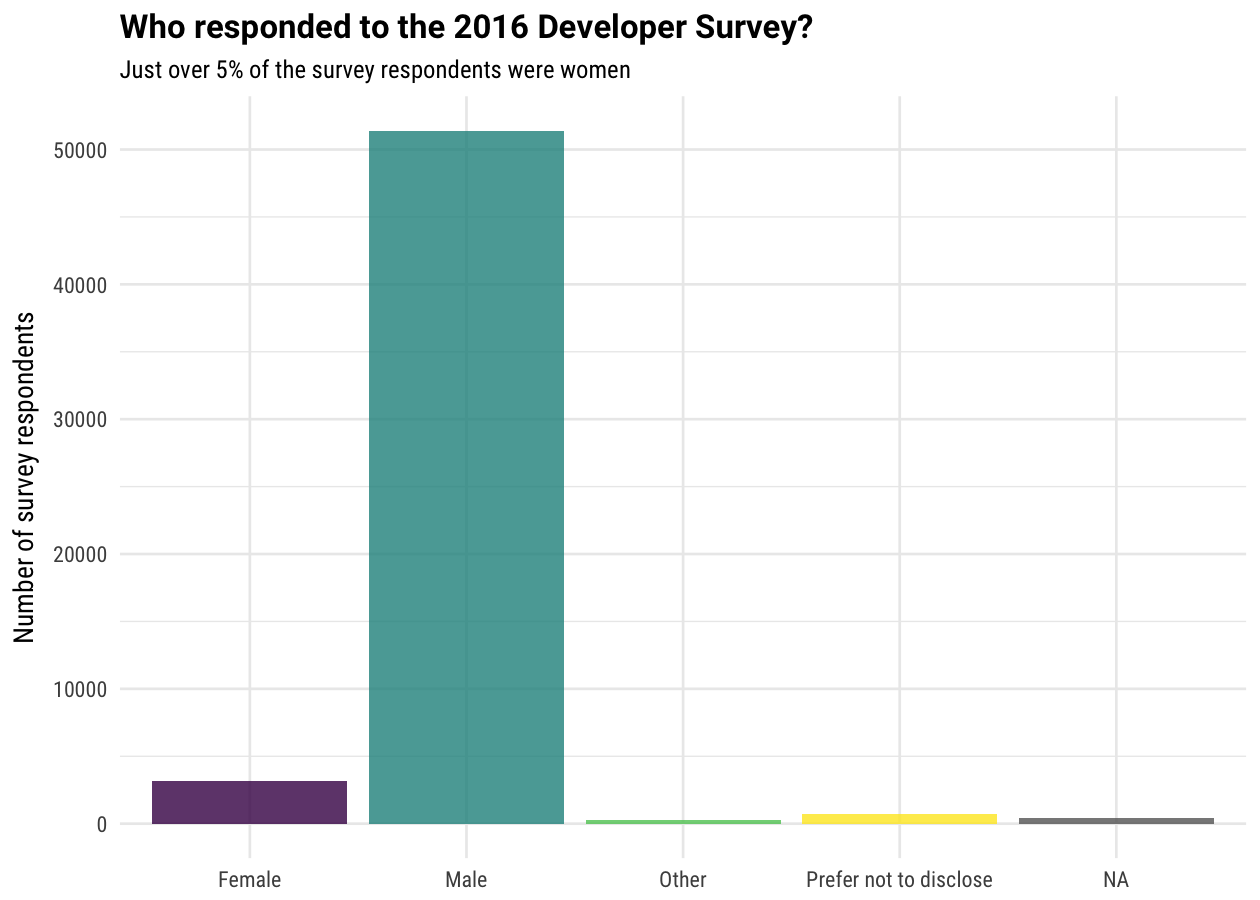
There were 3202 women who took the survey, which was 5.76% of the respondents. We all know that women are underrepresented in tech (I certainly am aware of this most days), but this is actually even lower than we would have expected. Audience demographic measurements from Quantcast indicate that Stack Overflow’s readers are about 10% women; survey respondents who identified as women took the survey at a lower rate than Quantcast indicates women use Stack Overflow itself.
We were disappointed to see this discrepancy last year because we want this survey to be representative of all kinds of developers. We at Stack Overflow value the voices of all of our users and would love to hear the perspectives of more people on our survey this year.
Why do we use Stack Overflow?
Next, let’s examine one question on the survey and explore how we can compare the answers given by women to those given by men. Let’s look at the question, “Why do you use Stack Overflow?” This is a question that allowed multiple answers.
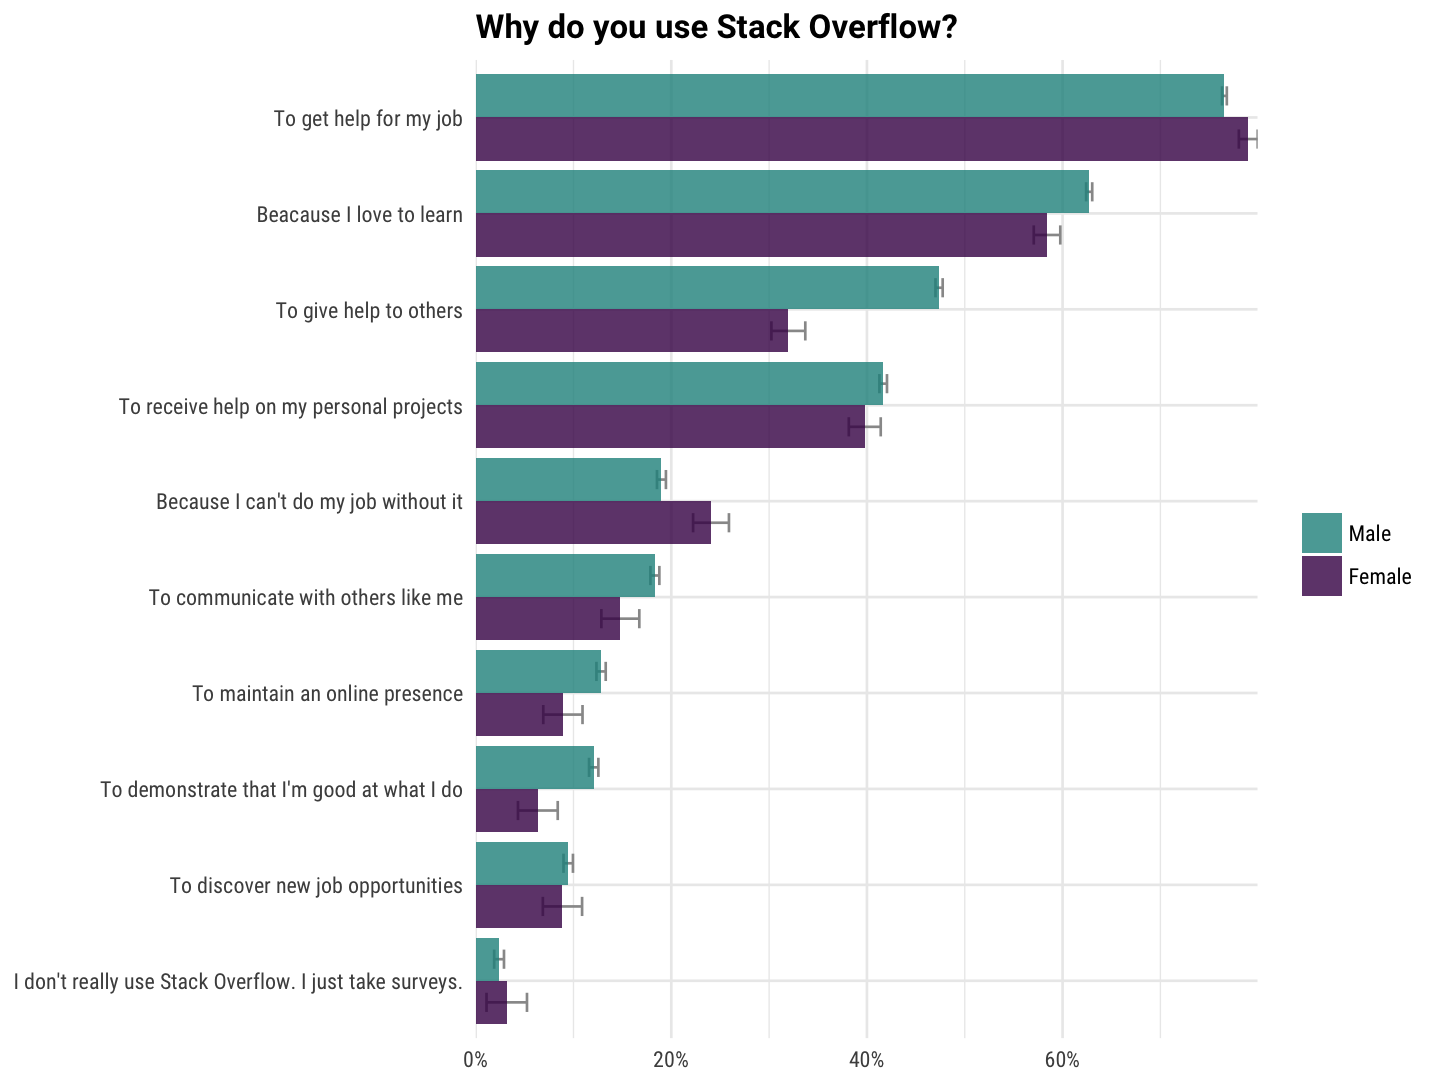
First, notice that the error bars are larger for the women’s answers than the men’s; this is because there were many more men in the survey than women and thus the values for women cannot be estimated as precisely as for men. Next, notice that some answers exhibit differences between women’s and men’s answers; for example, women were more likely to choose answers related to doing our jobs but less likely to choose answers related to helping others or maintaining an online presence.
Statistical analysis (specifically the chi-squared test) shows that the distribution of men’s answers is different than women’s answers more than would be expected by chance. This provides evidence that men and women have some different motivations or experiences when they come to Stack Overflow. Women said they use Stack Overflow more specifically for their jobs and chose very pragmatic answers to this question, instead of answers about helping or learning.
Technologies used
Another question on the survey asked about what technologies each respondent used; this was also a question that allowed multiple answers. How did men’s and women’s answers compare?
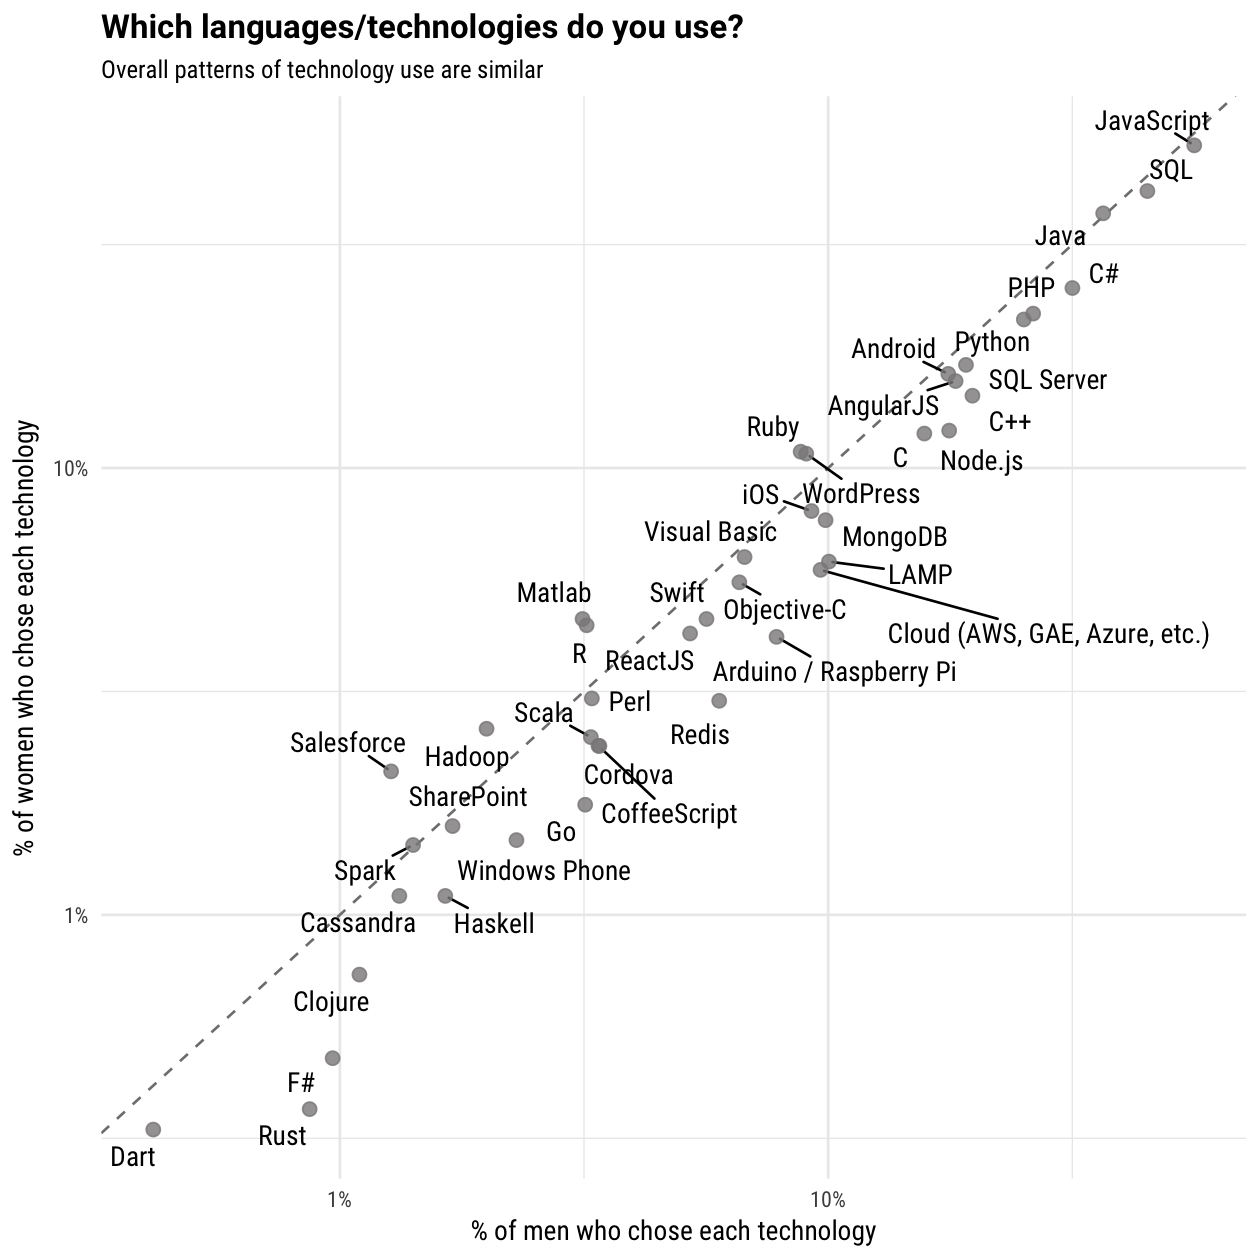
The x-axis in this plot shows what percentage of men chose each technology and the y-axis shows what percentage of women chose each technology; these are logarithmic axes. First notice that most technologies appear near the dashed line (with slope equal to 1), indicating that the overall pattern of technology choices by women and men are similar, i.e., lots of both men and women use JavaScript.
Also notice that almost all the languages and technologies are below the dashed line, meaning proportionally fewer women said they use most all technologies. Since this is a question that allowed multiple responses, this indicates that men chose more technologies on this question than women. In fact, men chose a median of 4 technologies on this question while women chose a median of 3 technologies. There are likely complex reasons behind this difference, including imbalance in how women and men evaluate their own skills, but one reason could be the fact that women in our survey were, on average, younger with less experience than men.
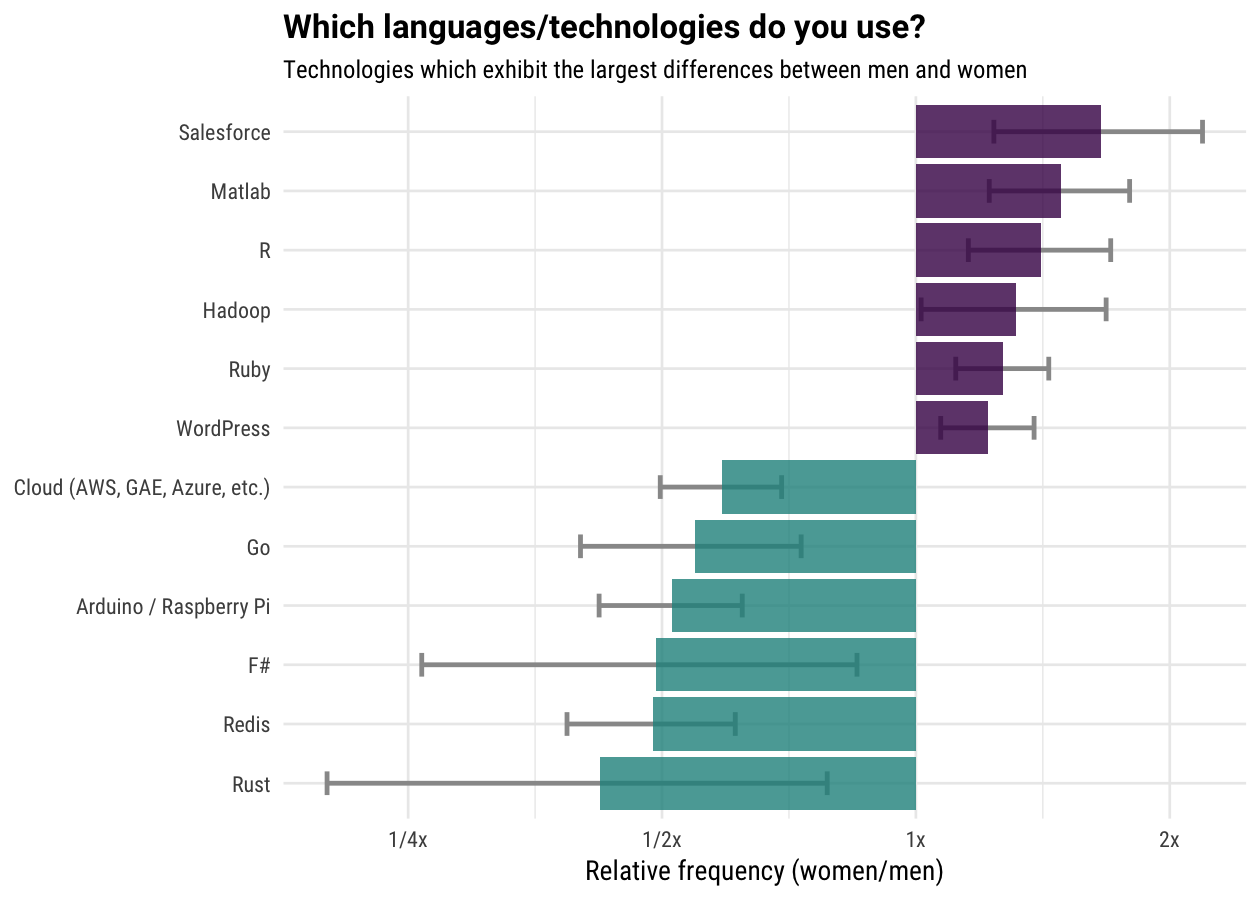
Although there are large-scale similarities between the technologies that women and men use, some technologies exhibit significant differences between the proportion of women and men who identified them. A higher proportion of women use Salesforce, Matlab, R, and Ruby; I use R professionally as a data scientist (and am a woman!) so this was fun and interesting to see. Languages and technologies with the highest proportion of men compared to women include Rust, Redis, F#, and Arduino/Raspberry Pi.
Exploring many survey questions
The questions above were just two of many on the Developer Survey, and we would like to look at more of the responses to find similarities and differences between women and men who work with technology. I built a Shiny app to allow users to explore these survey results themselves.
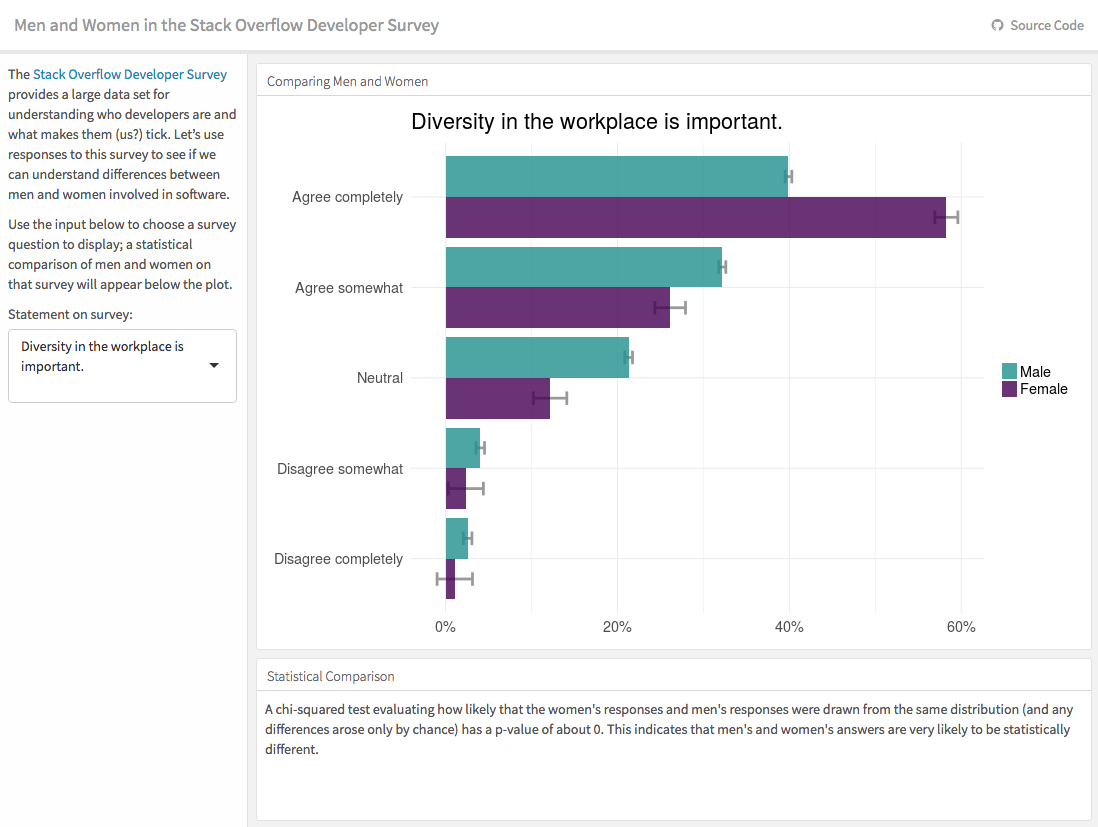
Notice several things as you explore the app:
- More than men, women think diversity in the workplace is important.
- Women are more likely to love their bosses and value the mission of their companies.
- More than men, women do not want to code late at night and value ending work at the same time every day and working from home.
- Some sets of answers (is learning new technologies important? do you love problem solving? is getting promoted important?) look the same or close to the same when comparing men and women.
- We all agree that we don’t want to go to Mars!
The upper panel in the app shows a plot with the survey results, and the lower panel shows the results of the chi-squared test that corresponds to that plot. We are comparing about 20 p-values here, which isn’t a huge number, but still I applied an adjustment for multiple comparisons. You can see the code that made this app on GitHub here.
These survey responses from men and women show us differences and similarities that can help us understand the developer community better. The 2017 Developer Survey is open right now, and we want to hear from you to gain more and better understanding. Just to reiterate one more time, we want to hear from all kinds of developers. Our results from last year show that underrepresented groups responded to the Stack Overflow Developer Survey at lower rates, so know that we want to hear what you (yes, you) think. Participate in the Developer Survey today!