Text Mining of Stack Overflow Questions
By Julia Silge
July 6, 2017
Note: Cross-posted with the Stack Overflow blog.
This week, my fellow Stack Overflow data scientist David Robinson and I are happy to announce the publication of our book Text Mining with R with O’Reilly. We are so excited to see this project out in the world, and so relieved to finally be finished with it! Text data is being generated all the time around us, in healthcare, finance, tech, and beyond; text mining allows us to transform that unstructured text data into real insight that can increase understanding and inform decision-making. In our book, we demonstrate how using tidy data principles can make text mining easier and more effective. Let’s mark this happy occasion with an exploration of Stack Overflow text data, and show how natural language processing techniques we cover in our book can be applied to real-world data to gain insight.
For this analysis, I’ll use Stack Overflow questions from StackSample, a dataset of text from 10% of Stack Overflow questions and answers on programming topics that is freely available on Kaggle. The code that I’m using in this post is available as a kernel on Kaggle, so you can fork it for your own exploration.
This analysis focuses only on questions posted on Stack Overflow, and uses topic modeling to dig into the text.
What is topic modeling?
Topic modeling is a machine learning method for discovering “topics” that occur in a collection of documents; it is a powerful tool for organizing large collections of raw text. Topic modeling is an unsupervised method, which means that I as the analyst don’t decide ahead of time what the topics will be about; we can find topics within text even if we’re not sure what we’re looking for ahead of time. Topic modeling can be used to discover underlying structure within text. In the context of the kind of topic model I’ll implement (LDA topic modeling),
- every document is a mixture of topics and
- every topic is a mixture of words.
Documents can share topics, and topics can share words, in any proportions. In our case for this analysis, each Stack Overflow question is a document. Let’s imagine (for the sake of explanation) that there are two topics, one that is made up of the three words “table”, “select”, and “join” and a second that is made up of the three words “function”, “print”, and “return.” One question might be 100% topic 2, and another question might be 50% topic 1 and 50% topic 2. The statistical modeling process of topic modeling finds the topics in the text dataset we are dealing with, which words contribute to the topics, and which topics contribute to which documents.
Modeling Stack Overflow questions
For this blog post, I fit a model with 12 topics to this dataset. The question of how to choose the number of topics in topic modeling is a complicated one, but in this case, 12 topics gives us a good result for exploration. The process of building this topic model also involves cleaning text, removing stop words, and building a document-term matrix, all considerations covered in our book.
One of the most compelling reasons to adopt tidy data principles when doing topic modeling is that we can easily explore which words contribute the most to which topics, and which topics contribute the most to which documents (questions on Stack Overflow, in this case). This is how we find out what kind of content corresponds to the topics fit by the model. Let’s look at that for these specific questions. Which words are most important for each topic, in this model with 12 topics?
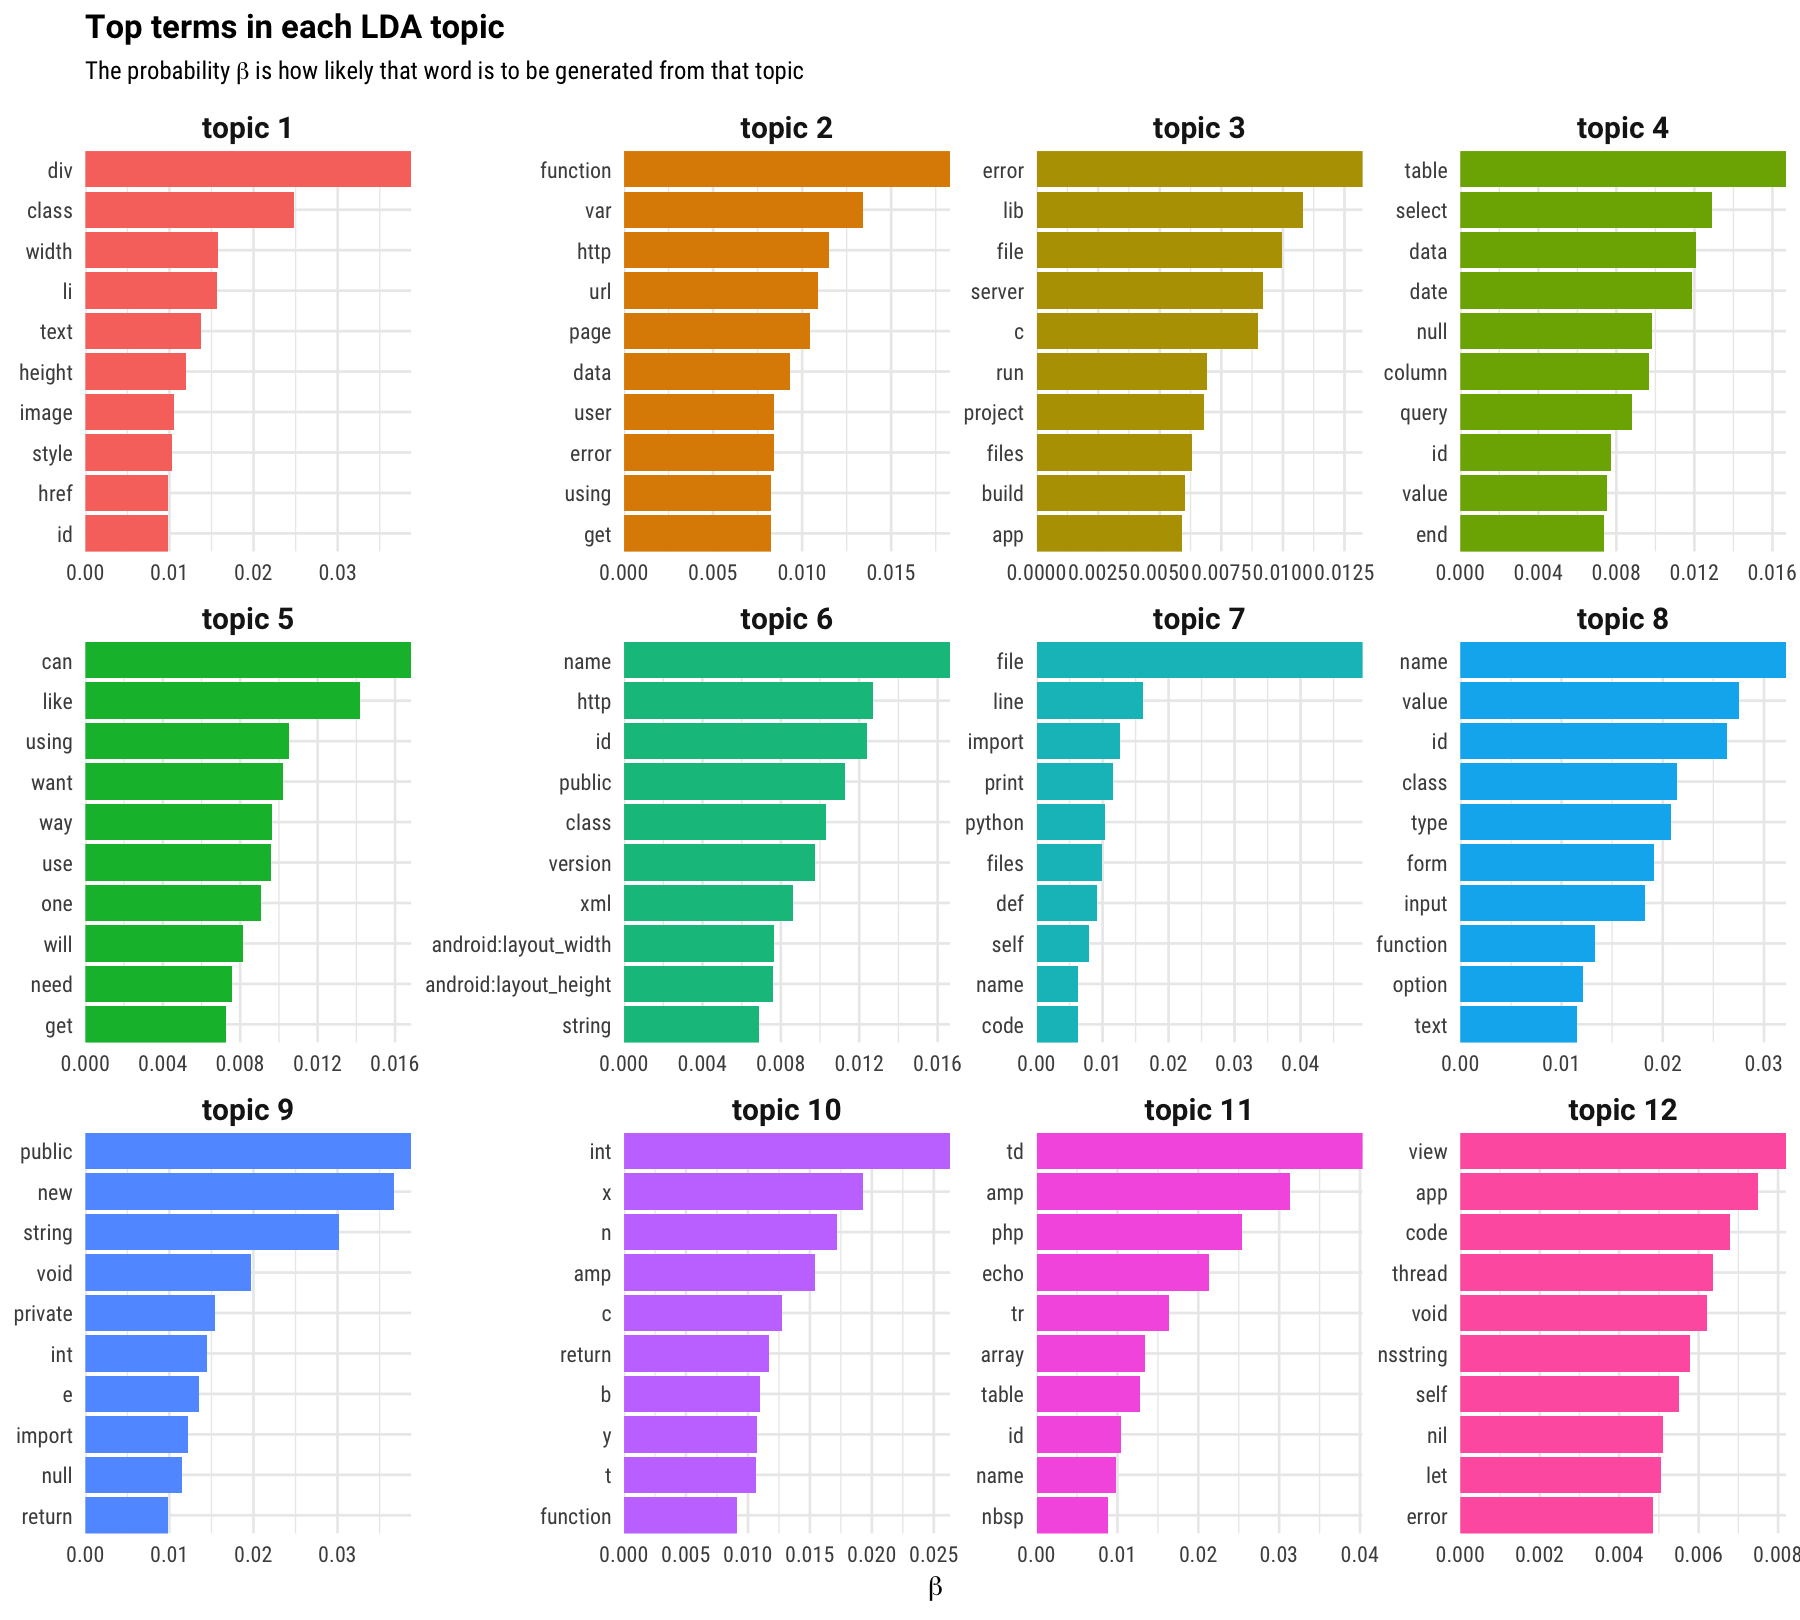
First look at topic 5. That topic is all English words, not terms from code; the topic model has fit one topic that is not specific to any tag, programming language, or technology used on Stack Overflow but instead aligns with the text people use to talk about their questions. Next, look at topic 3; most of those words look very general to me and applicable to almost all technologies (“file”, “error”, “server”, and so forth). Last, look through some of the other collections of terms. For some tech ecosystems that I am familiar with, these collections of terms make sense together.
What if there are words you are interested in, but that you don’t see in these plots? We can use tidy data principles to find which topic any word has the highest probability of being generated from. For example, “git” and “docker” are most likely to be generated from topic 3, “boost” is most likely to be generated from topic 10, and “ggplot2” (my own personal favorite data visualization tool!) is most likely to be generated from topic 4.
Connecting to tags
We can look at this from a different angle because each question on Stack Overflow has a tag, like “r” or “c#” or “sql”. The topic model estimates a probability that each document belongs to each topic; it’s the estimated proportion of words from that document that are generated from that topic. We know the tags for each document, so let’s examine which tags are associated with each topic.
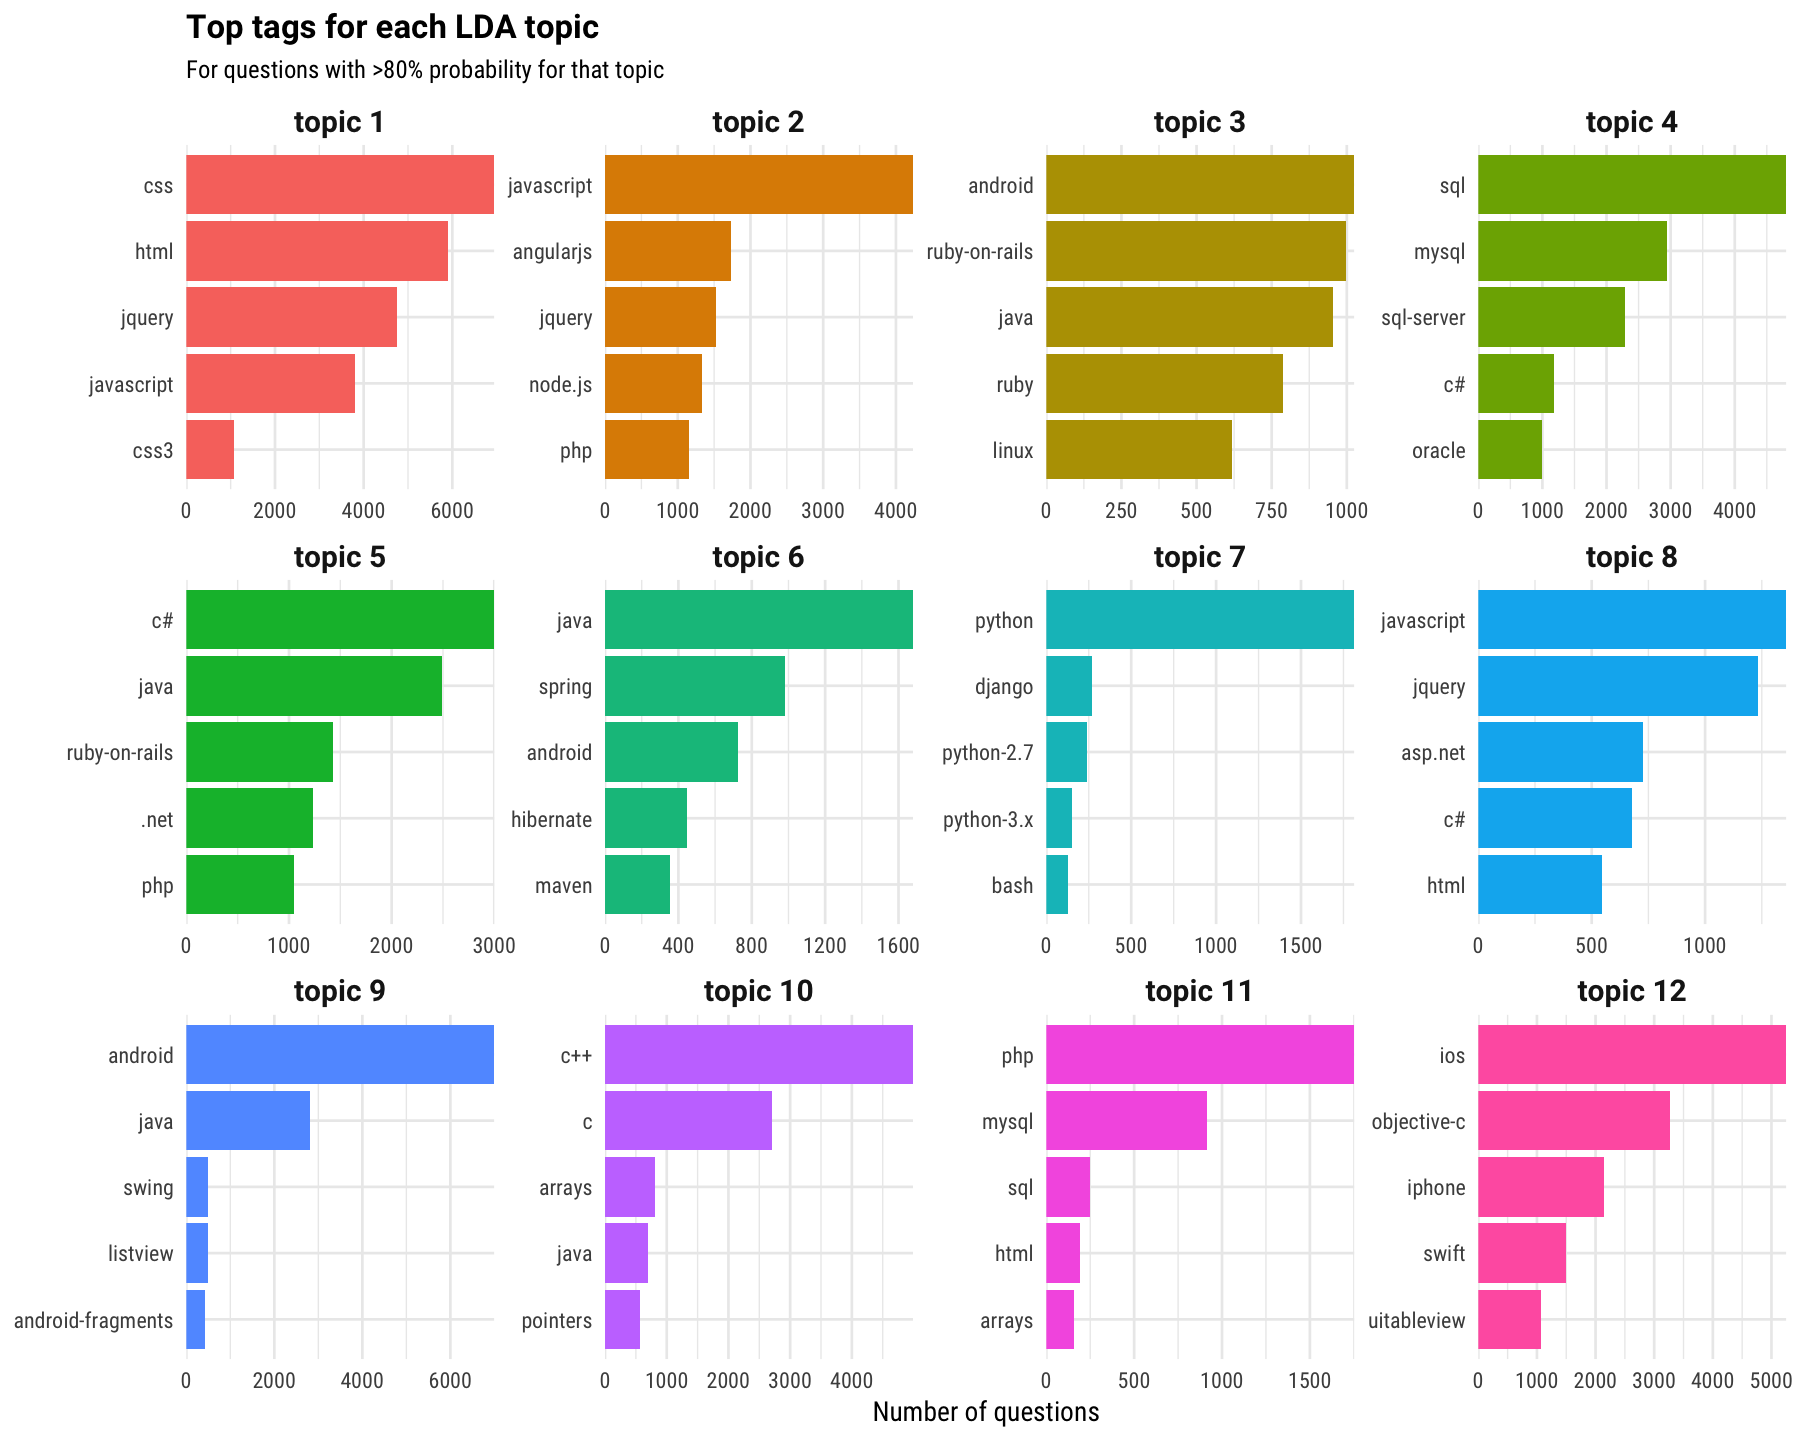
Remember that topic 5 was the one that corresponded to English words where users discuss and describe their problem, so that is a measure of something different than the other topics. Topic 1 looks like front-end web development, topic 4 is databases, topic 10 is C and low-level programming, and so forth. Remember, the tags did not go into the unsupervised modeling process; we are just looking at them after the fact. The topic modeling process has taken the raw text of Stack Overflow questions and discovered underlying patterns and structure. This is what topic modeling does, whether you are looking at NASA metadata or classic literature.
Let’s look at a few real examples from this dataset so you can see how this worked out. Each of the following questions is part of the StackSample dataset and this particular topic model.
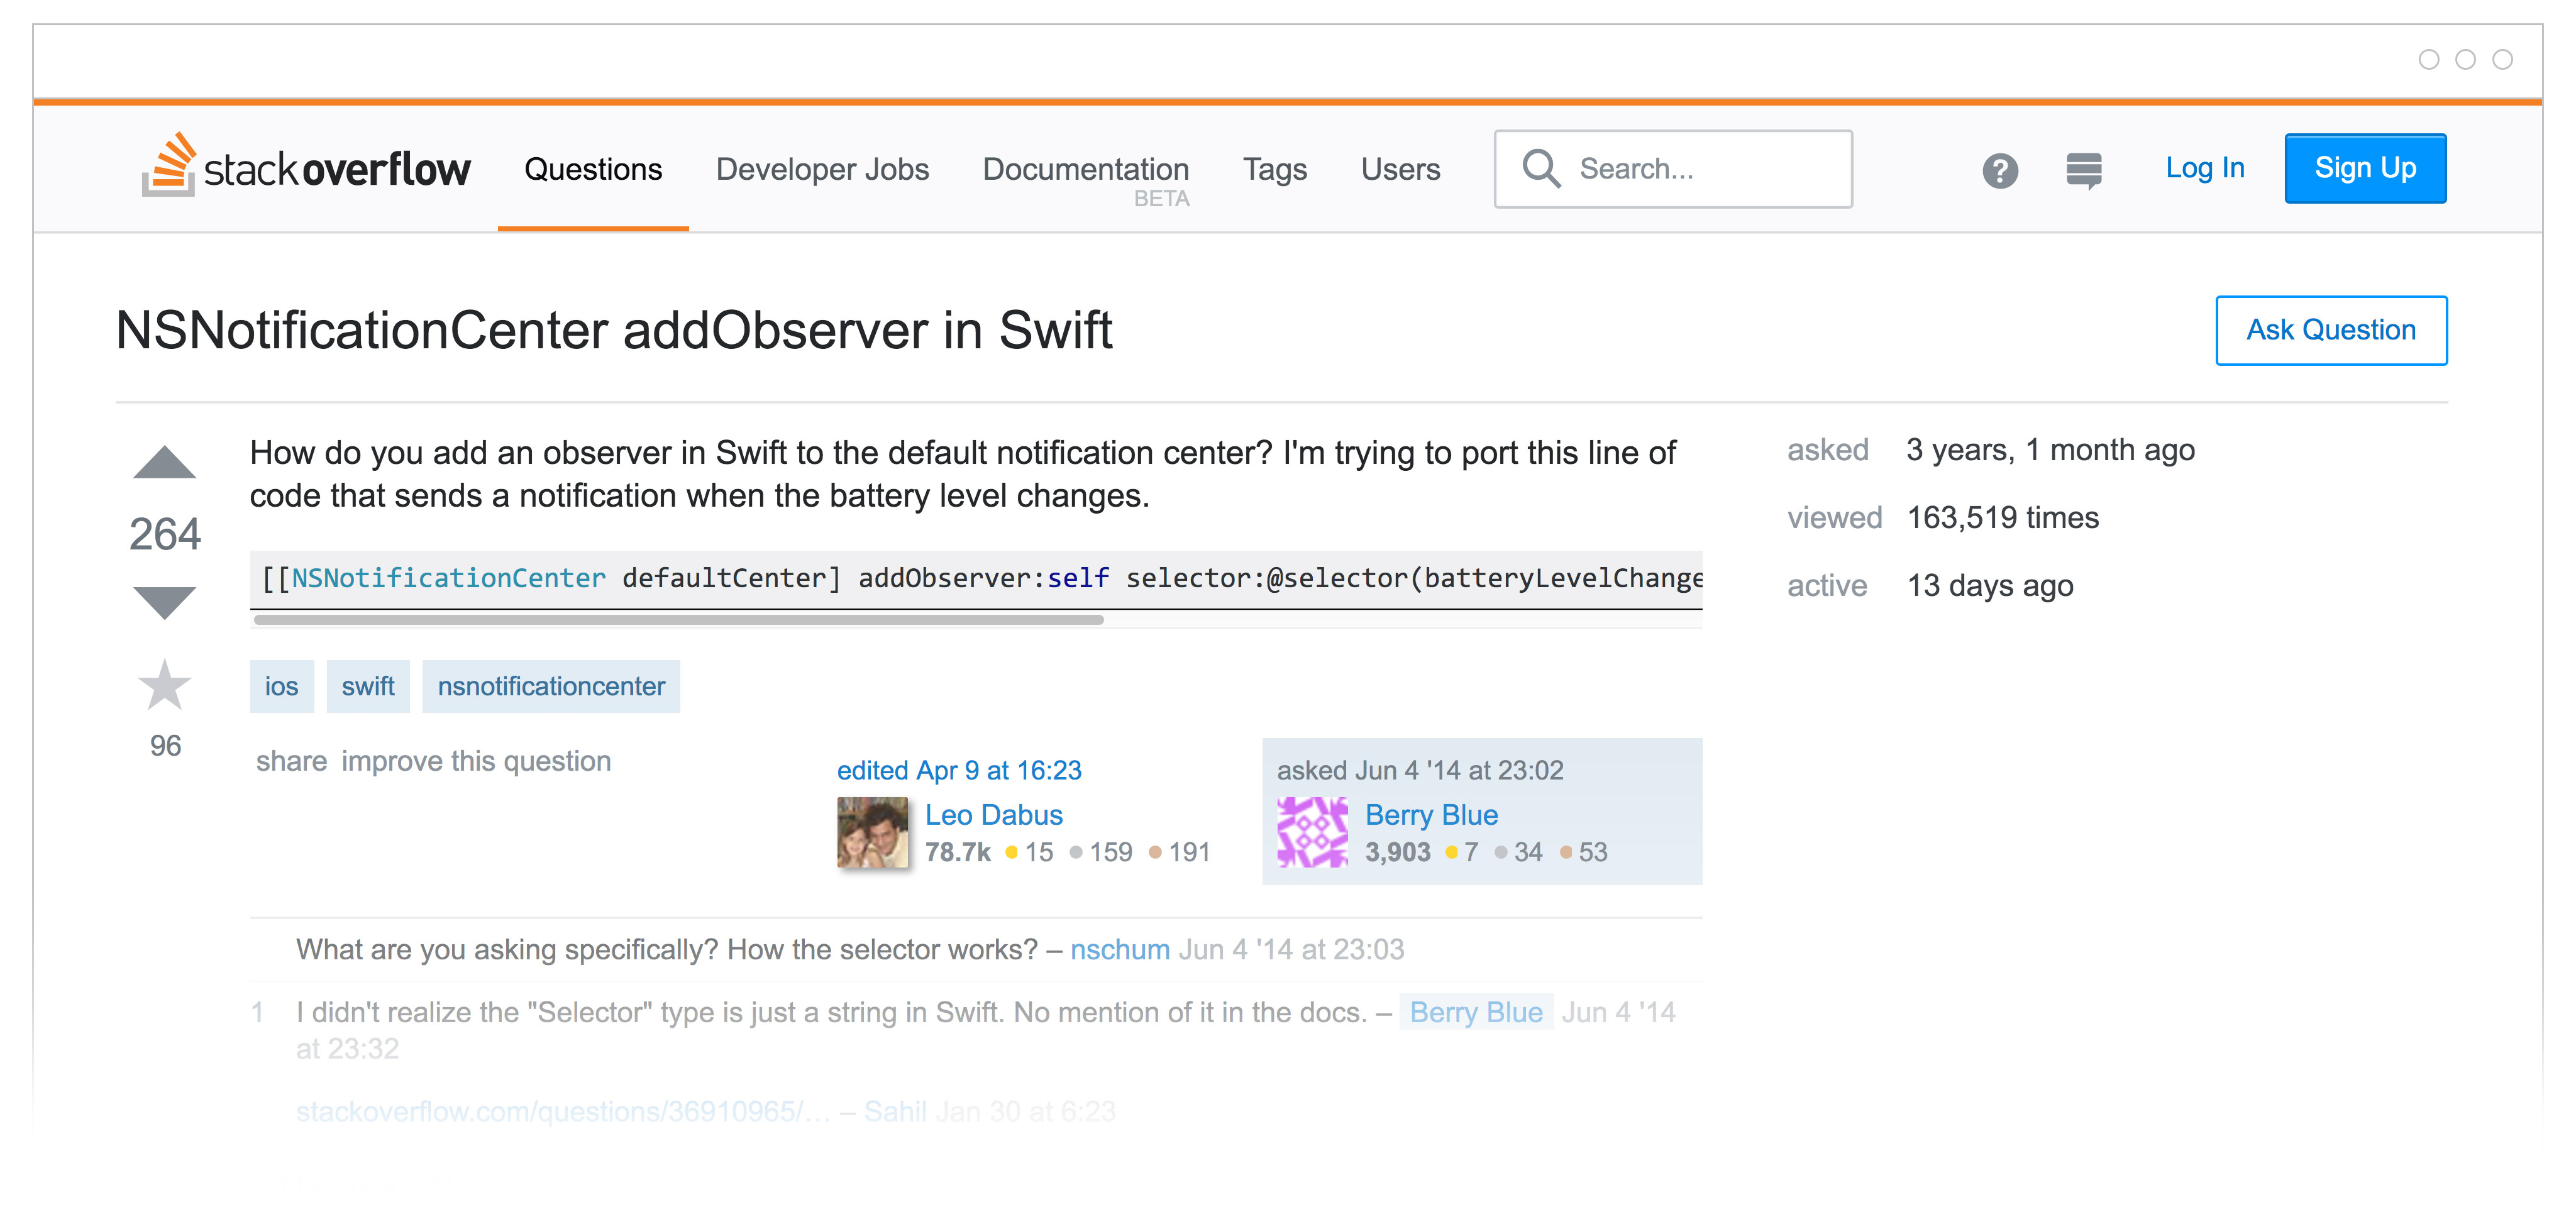
This first example question is relatively short, and the topic model estimates that is 91% topic 12 and 6% topic 3. Looks good! I don’t see many of the top 10 terms from the first plot in this blog post for topic 12 here, but the topic model has classified it into the topic that is dominated by iOS, Objective-C, iPhone, and Swift.
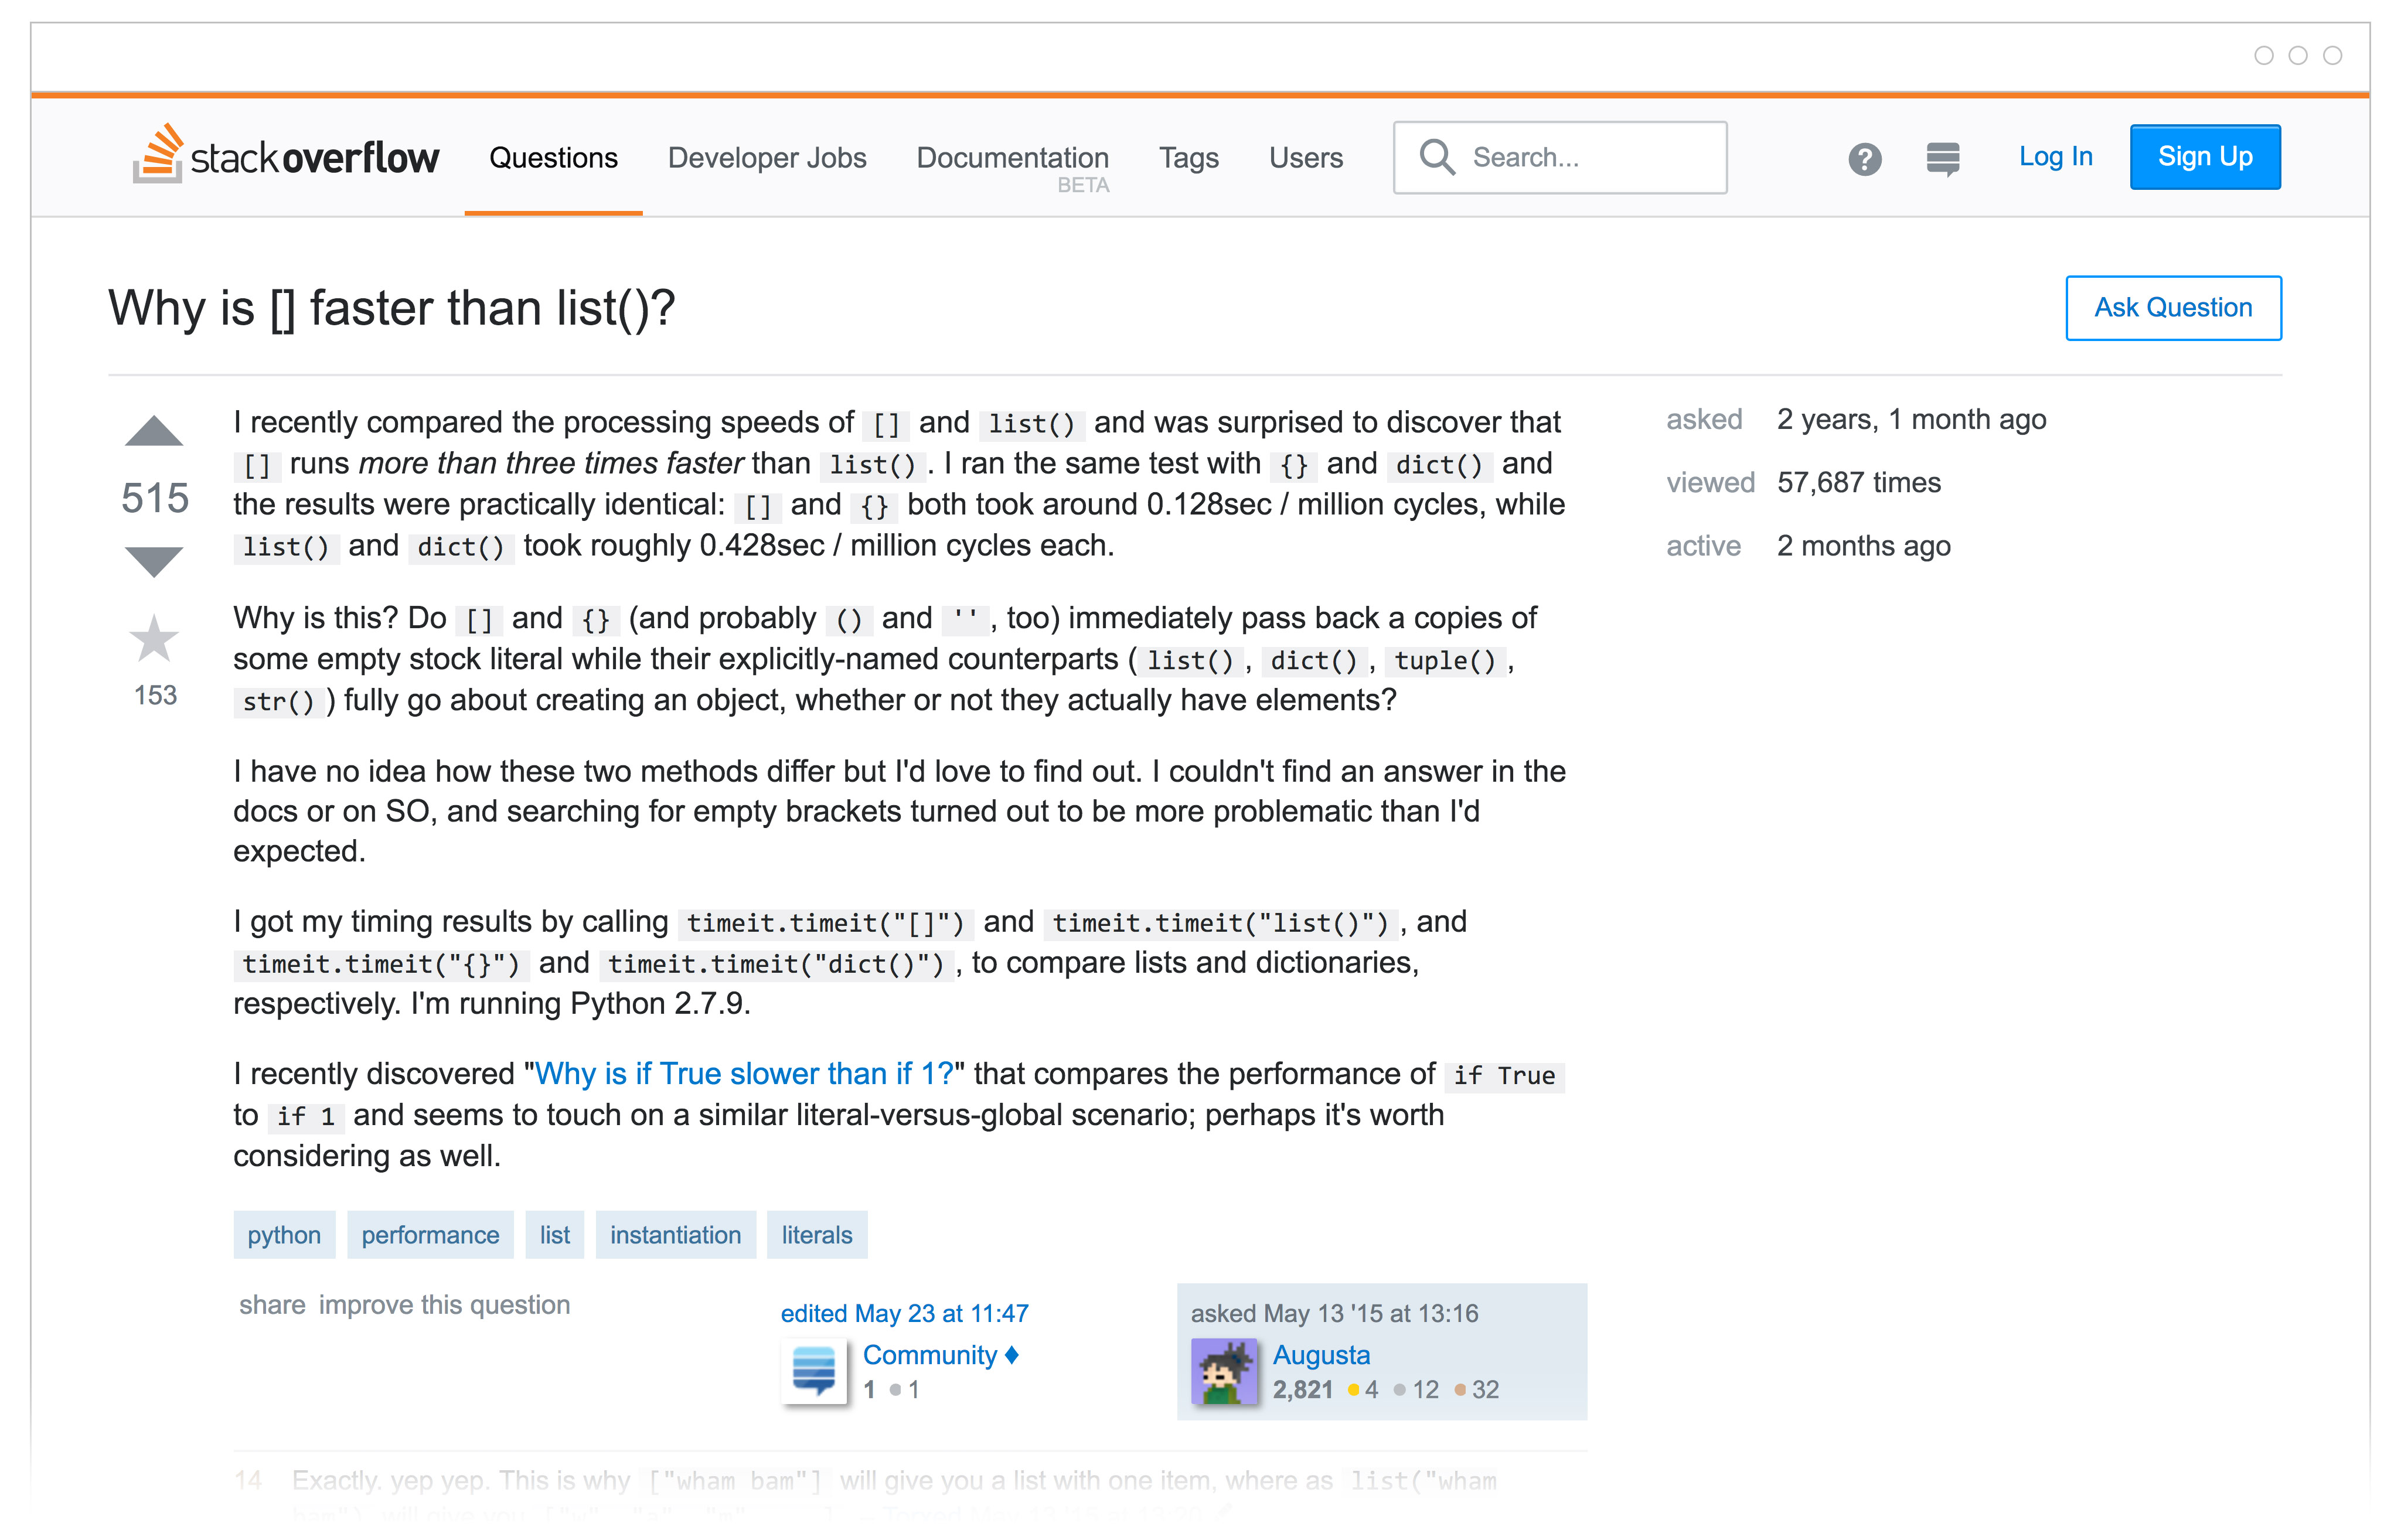
Our second example question is longer, and the topic model estimates that it is 82% topic 5 and 18% topic 7. This question has a lot of English text and not much code, and that is reflected by the modeling. The model has chosen topic 7, dominated by Python and Django, for this question.
Last, let’s look at this Haskell question. Haskell is a sparsely used tag, and did not show up in the plot of top tags for topics at all. Where did this question land? The model estimates that this question is 63% topic 5 and 36% topic 10, with a tiny smidge of topic 7. I actually really like that the model has done this, putting Haskell in with low-level tags like C++/C, arrays, and pointers.
A model like this is not just for analysis; it can be used to make predictions or implement new ideas. For example, one idea for Stack Overflow would be to automatically suggest a list of possible tags for new questions based on the text of a question. It looks like such a feature would work best for questions with at least some code and would be less accurate suggesting tags for questions that are almost all English words, or for very unusual tags. If there are any particular questions or tags you would like to explore yourself, fork the kernel on Kaggle and build a topic model yourself!
Approaches like topic modeling can provide a way to get from raw text to a deeper understanding of unstructured data. In our book, we discuss these and other text mining tasks, from the nitty gritty of converting back and forth between common text data structures to measuring tf-idf to sentiment analysis. One of the things I like best about working as a data scientist at Stack Overflow is applying tools exactly like these to real-world data from the developer community, to learn about developers worldwide and to help clients make decisions about hiring and engaging with developers. Check out Developer Insights to learn more.