Mapping ecosystems of software development
By Julia Silge
October 3, 2017
I have a new post on the Stack Overflow blog today about the complex, interrelated ecosystems of software development. On the data team at Stack Overflow, we spend a lot of time and energy thinking about tech ecosystems and how technologies are related to each other. One way to get at this idea of relationships between technologies is tag correlations, how often technology tags at Stack Overflow appear together relative to how often they appear separately. One place we see developers using tags at Stack Overflow is on their Developer Stories. If we are interested in how technologies are connected and how they are used together, developers’ own descriptions of their work and careers is a great place to get that.
I released the data for this network structure as a dataset on Kaggle so you can explore it for yourself! For example, the post for Stack Overflow includes an interactive visualization created using the networkD3 package but we can create other kinds of visualizations using the ggraph package. Either way, trusty igraph comes into play.
library(readr)
library(igraph)
library(ggraph)

stack_network <- graph_from_data_frame(read_csv("stack_network_links.csv"),
                                       vertices = read_csv("stack_network_nodes.csv"))

set.seed(2017)
ggraph(stack_network, layout = "fr") +
    geom_edge_link(alpha = 0.2, aes(width = value)) +
    geom_node_point(aes(color = as.factor(group), size = 10 * nodesize)) +
    geom_node_text(aes(label = name), family = "RobotoCondensed-Regular",
                   repel = TRUE) +
    theme_graph(base_family = "RobotoCondensed-Regular") +
    theme(plot.title = element_text(family="Roboto-Bold"),
          legend.position="none") +
    labs(title = "Stack Overflow Tag Network",
         subtitle = "Tags correlated on Developer Stories")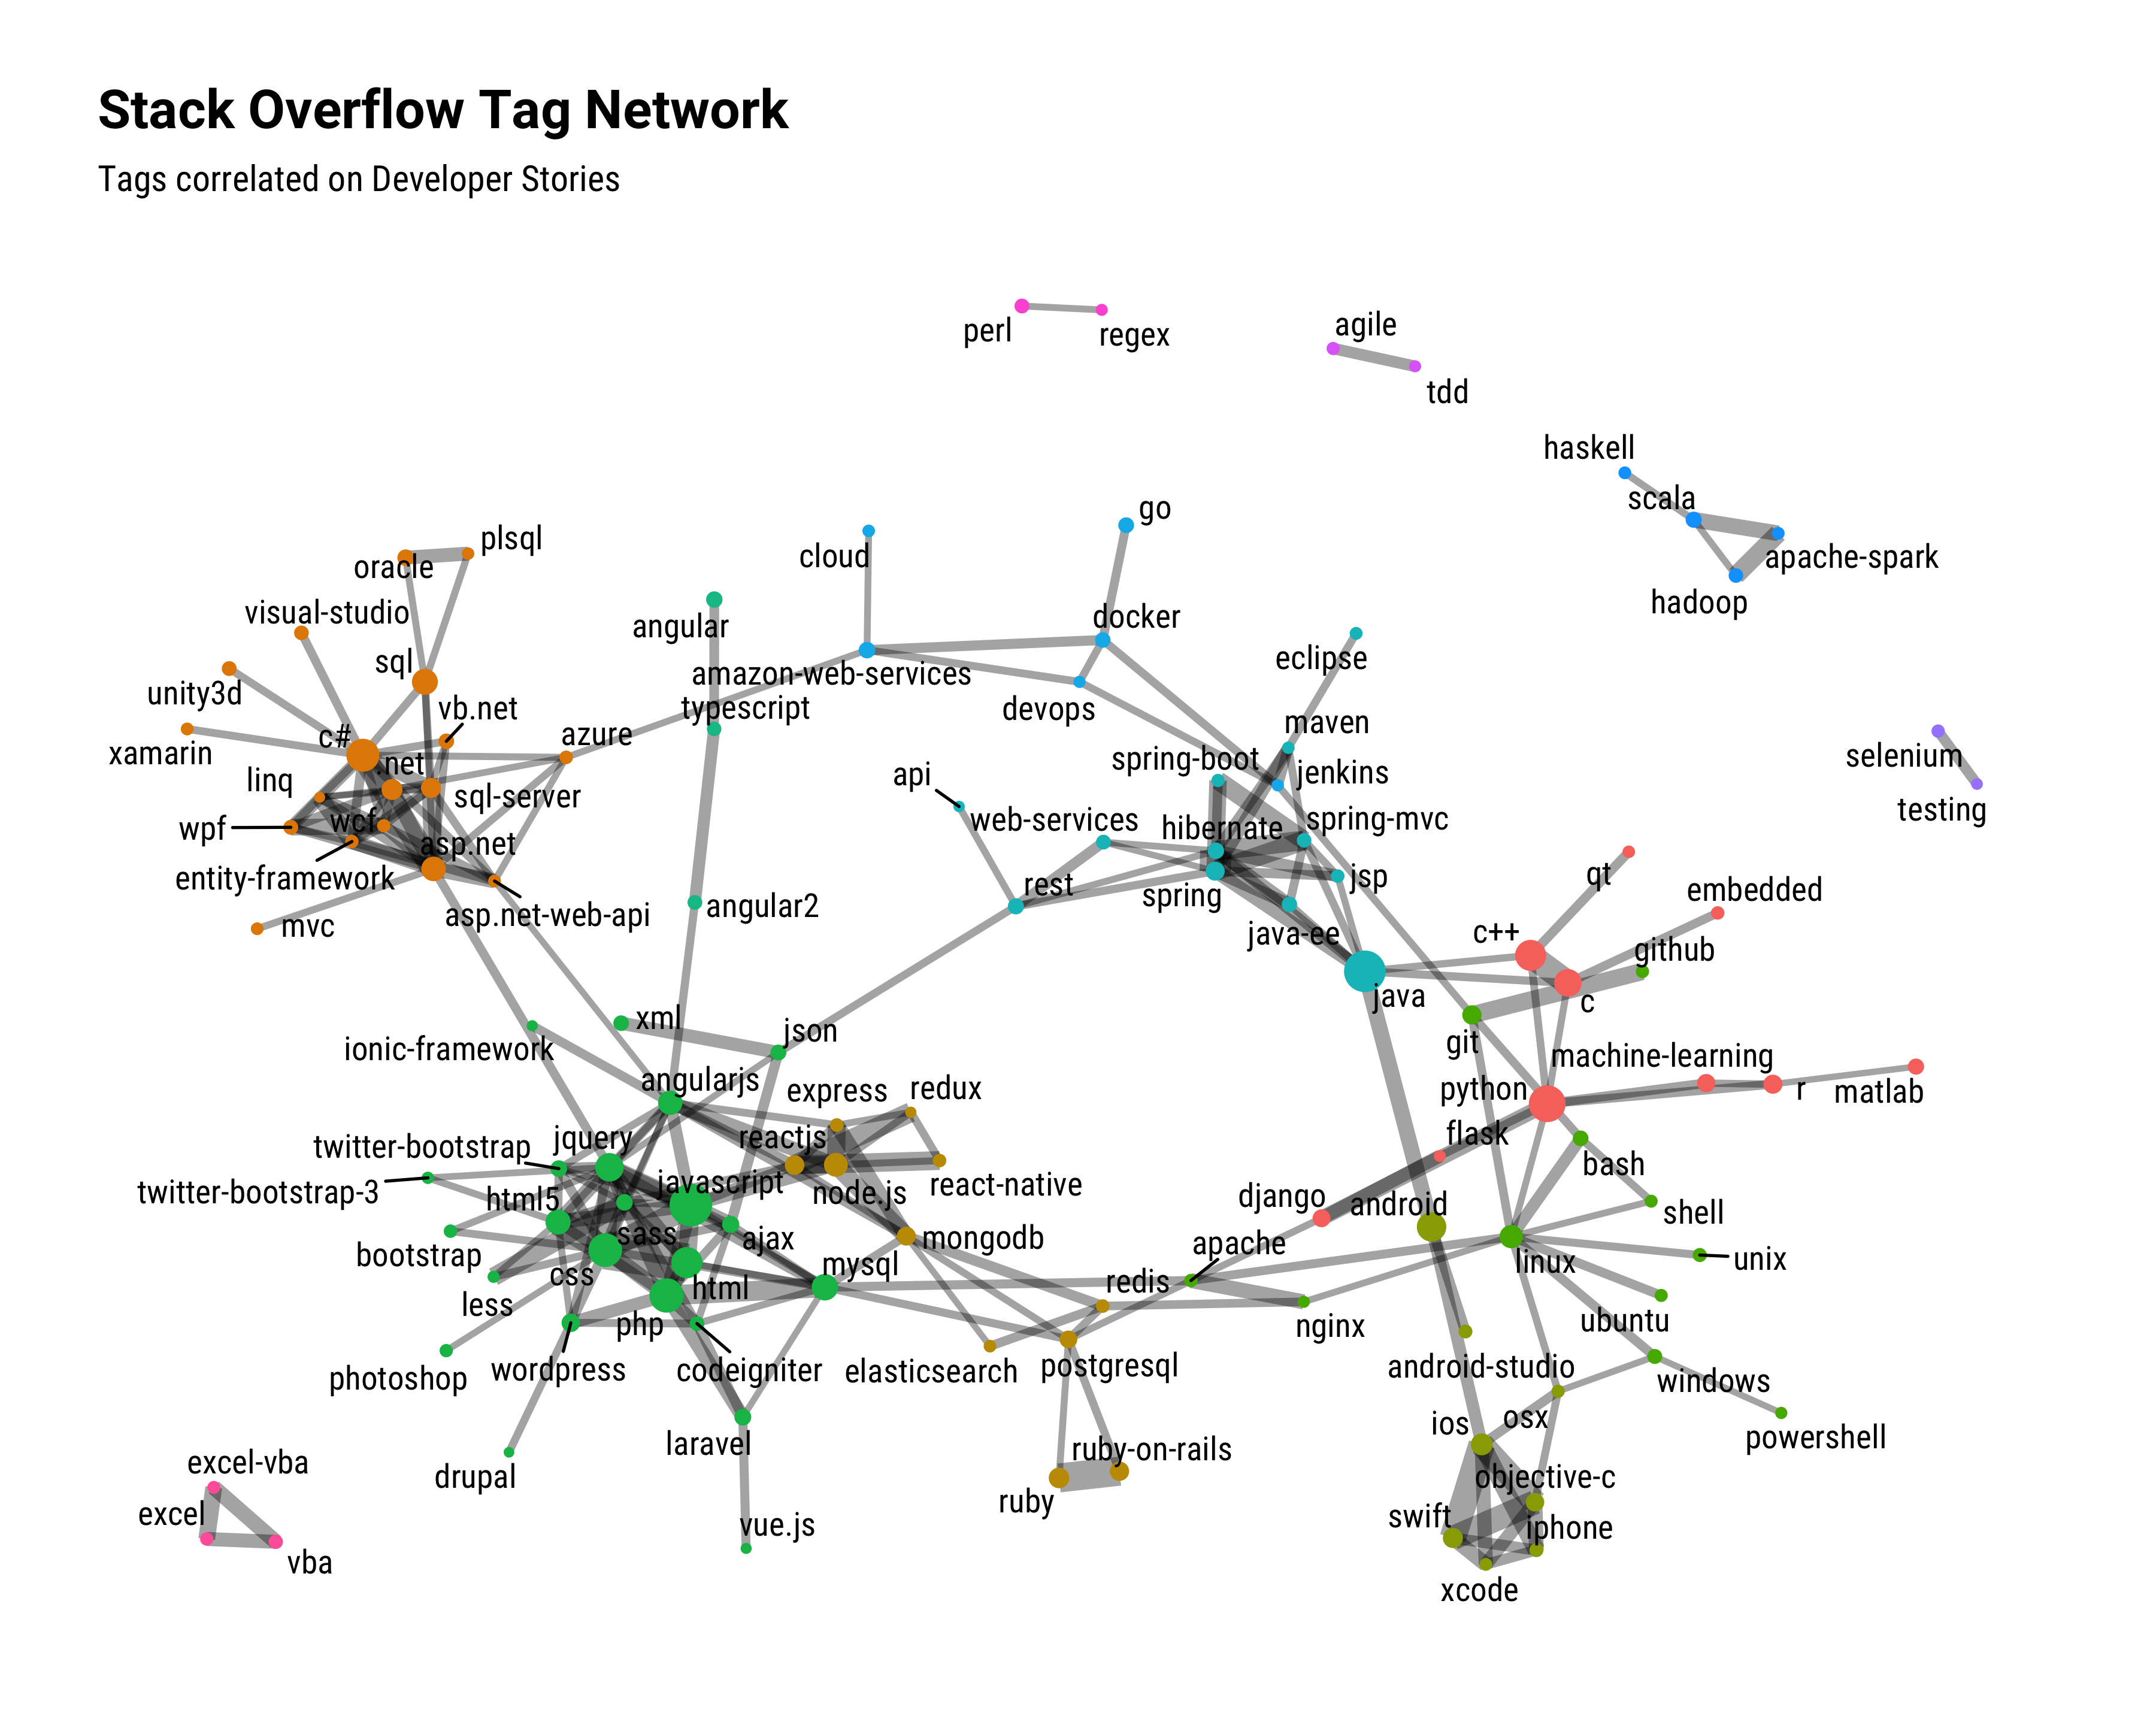
We have explored these kinds of network structures using all kinds of data sources at Stack Overflow, from Q&A to traffic, and although we see similar relationships across all of them, we really like Developer Stories as a data source for this particular question. Let me know if you have any comments or questions!