From Power Calculations to P-Values: A/B Testing at Stack Overflow
By Julia Silge
October 17, 2017
Note: cross-posted with the Stack Overflow blog.
If you hang out on Meta Stack Overflow, you may have noticed news from time to time about A/B tests of various features here at Stack Overflow. We use A/B testing to compare a new version to a baseline for a design, a machine learning model, or practically any feature of what we do here at Stack Overflow; these tests are part of our decision-making process. Which version of a button, predictive model, or ad is better? We don’t have to guess blindly, but instead we can use tests as part of our decision-making toolkit.
I get excited about A/B tests because tests like these harness the power of statistics and data to impact the day-to-day details of our business choices. Des Navadeh is the product manager of the Jobs team here at Stack Overflow, and she has used testing extensively on her team to guide decisions. Des says, “A/B testing helps us gain confidence in the change we’re making. It helps us validate new ideas and guides decision making. Without A/B testing, we’re leaving much of what we do up to chance.”
At the same time, there can be confusion about how to approach an A/B test, what the statistical concepts involved in such a test are, and what you do before a test vs. after a test. Des and her team have learned a lot by implementing many tests, but also have had some stumbles. “We didn’t realize it at the time, but when we started A/B testing, we took a very strict approach in the calculations to determine sample size. As a result, we were running tests for an unnecessary length of time and most were deemed inconclusive. We basically set up our tests to be almost 100% confident which isn’t very realistic or productive!” Des says.
To start testing off on the right foot, we need to plan for an A/B test and perform a power calculation. This requires defining a hypothesis and test groups, and then considering two questions.
- How sure do we need to be that we are measuring a real change?
- How big is the change we expect to see because of the new version, compared to the baseline?
Let’s start with the first question.
How sure do you need to be?
I am sad to have to break this to you all, but the answer to that first question can’t be 100%. When we measure something in the real world, we never measure with exact accuracy and precision. (That’s basically why I have a job, I think!) There are two main quantities that statisticians use to talk about how much and in what way we can be wrong in measuring.
- What percentage of the time are we willing to miss a real effect? This is measured by power.
- What percentage of the time are we willing to be fooled into seeing an effect by random chance? This is called significance level, and more precisely, we would state this as the probability of rejecting the null hypothesis.
We also talk about these kinds of errors as the false negative rate and false positive rate, which can be very easy to understand given the right example.
Typical statistical standards for these quantities are 80% for power (i.e., 20% chance of a false negative) and 5% for significance level. Why are these standards used in practice? That’s a great question with a fair amount of baggage and tradition behind it. If we choose standards that are too strict, perhaps 95% for power and 1% for significance level, all our A/B tests will need to run longer and we will have to invest more time and resources into testing. We won’t be able to iterate quickly to solve our business problems. On the other hand, we’re not curing cancer here, right?! What if we relaxed these statistical standards? Then we risk making change after change in our product that does not improve anything, and investing work from our developers and other team members in changes that do not move us forward toward our goals. We want to be Goldilocks-just-right when it comes to these standards for our purposes. For us at Stack Overflow, that means consistently using 80% for power and 5% for significance level in our power calculations before an A/B test.
How big is your change?
Our second question here is not about statistical standards, but instead is about how big of a difference we expect to see with the proposed change compared to the status quo. Some phrases that people use to talk about this concept are effect size, expected improvement, and improvement threshold. Effect size can be different in different contexts and different parts of our business.
Estimating effect size requires strategic product thinking. Des says, “You need to first understand how different areas of your product perform. Understanding how each part of your funnel converts today helps you decide how big of an effect you’d need to see for the new change to be worth it. We use different questions to help estimate the effect size. How much development work is required to graduate the test? How strategically important is it? Does this feature support future plans? What is the size of audience or action are we optimizing for? These answers are detailed as success criteria in our test plans.” Some of the factors Des takes into account when estimating effect size are volume of events that enter the funnel that is being considered, baseline conversion rate of the feature, and how the expected improvement impacts overall product metrics.
Power calculations
Once we have estimated an effect size for our test and know the statistical standards we are going to use in planning, we can do a power calculation to find out how big of a sample size we need for our test. The point of power calculations like these is to find out what sample size we need for our A/B test, how many views or users or form submissions or other interactions we need in each group to achieve the necessary power for our test. Then we can finally start our test! Time to wait for those events to roll in.
How do we calculate how big of a sample we need, to measure the change we expect with the statistical standards we’ve chosen? For most tests, our product teams use online calculators to find the sample size. I’m an R developer, so I would use a function in R for such a test. For more complicated tests, we on the data team sometimes run simulations for power calculations.
When we calculate power, we see first-hand how power, significance level, and effect size interact with sample size and the baseline conversion rate that we were dealing with to start with. I built a Shiny app to demonstrate how these factors are related for a proportion test, which is typically applicable in our A/B tests.
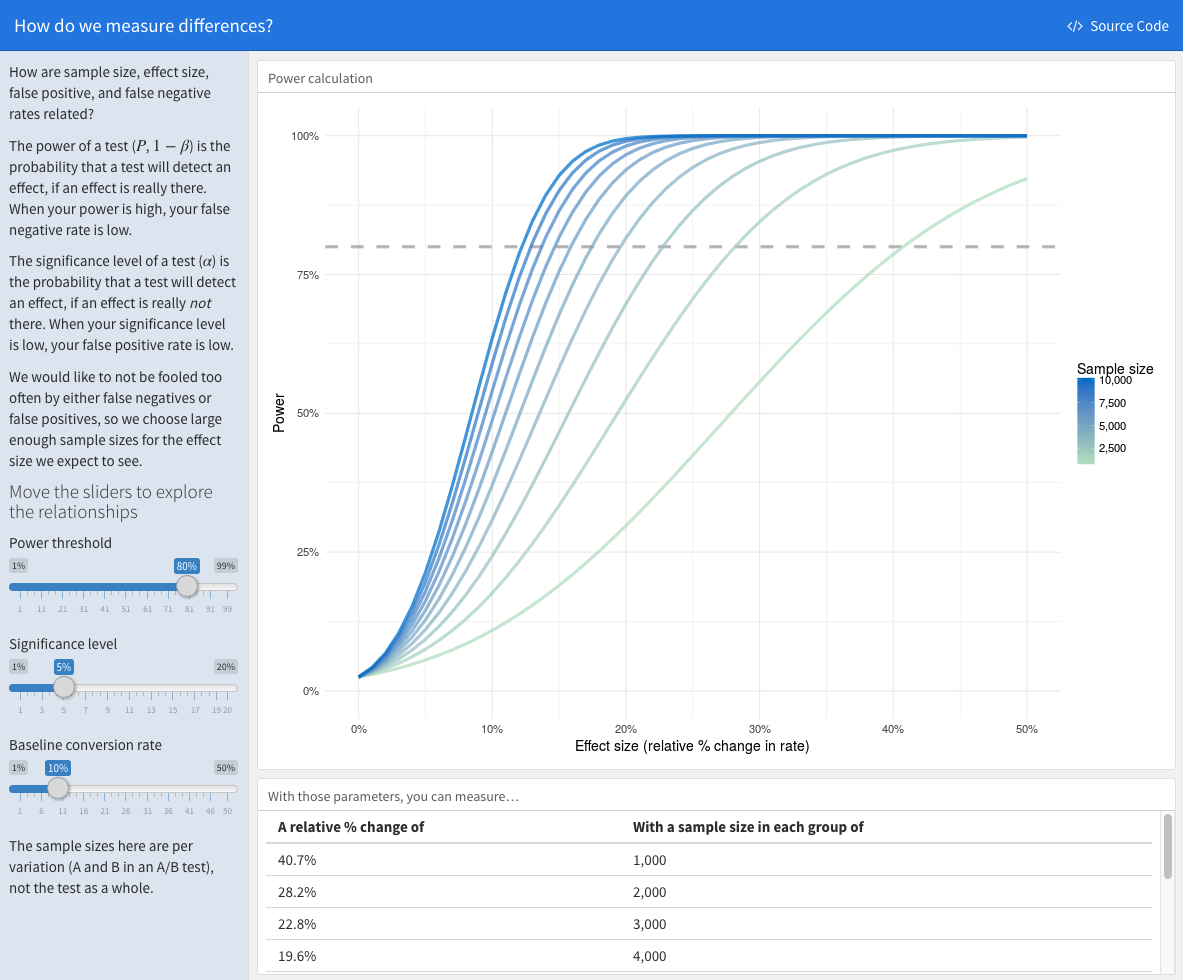
You can click the “Source Code” button on the app to see the R code that built this app. Notice the shapes of the curves, and how they change when you move the sliders. We need bigger sample sizes to measure small effect sizes, or to achieve low significance levels. If the baseline rate is higher to start with, the sample size needed for a given power goes down. These complicated interactions affect our A/B tests at Stack Overflow.
“We realized that we couldn’t standardize power calculations across all tests. Some parts of our funnel were highly optimized and converted well, which meant we needed smaller samples sizes to detect the same effect we would want to see in an area that didn’t convert as well,” Des says. “Other areas had higher volume, like page views, but did not convert at well. While higher volume helps us reach the sample size need faster, we needed a larger effect size for the change to make an impact.”
Analyzing results
What happens after the test? After we have collected enough events to meet our sample size requirements, it’s time to analyze the results. At Stack Overflow, we have testing infrastructure for teams to automatically see analysis of results, or if I am performing an analysis myself, I might use a statistical test like a proportion test using R. “We know we can end a test when we’ve reached the sample size we set out to collect, and then we check out the p-value,” Des says. The p-value of an A/B test is the probability that we would get the observed difference between the A and B groups (or a more extreme difference) by random chance. When the p-value is high, that means the probability that we could just randomly see that difference between the A and B groups is high, due only to sampling noise. When the p-value of our A/B test is low enough (below our threshold), we can say that the probability of seeing such a difference randomly is low and we can feel confident about making the change to the new alternative from our original version.
If you pay attention to the world of statistics, you may have seen some hubbub about changing the threshold for p-values; a recent paper claimed that moving from a threshold of 0.05 to 0.005 would solve the reproducibility crisis in science and fix, well, lots of things. It’s true that using a threshold of p < 0.05 means being fooled 1 in 20 times, but ultimately, the problem with using statistics and measurement isn’t p-values. The problem is us. We can’t apply these kinds of thresholds without careful consideration of context and domain knowledge, and a commitment to honesty (especially to ourselves!) when it comes to p-values. We are sticking with a p-value threshold of 0.05 for our A/B tests, but these tests must always be interpreted holistically by human beings with an understanding of our data and our business.
When to JUST SAY NO to an A/B test
Tests like the ones Des and I have talked about in this post are a powerful tool, but sometimes the best choice is knowing when not to run an A/B test. We at Stack Overflow have encountered this situation when considering a feature used by a small number of users and a potential change to that feature that we have other reasons for preferring to the status quo. The length of a test needed to achieve adequate statistical power in such a situation is impractically long, and the best choice for us in our real-life situation is to forgo a test and make the decision based on non-statistical considerations.
“Product thinking is critical here. Sometimes a change is obviously better UX but the test would take months to be statistically significant. If we are confident that the change aligns with our product strategy and creates a better experience for users, we may forgo an A/B test. In these cases, we may take qualitative approaches to validate ideas such as running usability tests or user interviews to get feedback from users,” says Des. “It’s a judgement call. If A/B tests aren’t practical for a given situation, we’ll use another tool in the toolbox to make progress. Our goal is continuous improvement of the product. In many cases, A/B testing is just one part of our approach to validating a change.”
Along the same lines, sometimes the results of an A/B test can be inconclusive, with no measurable difference between the baseline and new version, either positive or negative. What should we do then? Often we stay with the original version of our feature, but in some situations, we still decide to make a change to a new version, depending on other product considerations.
Dealing with data means becoming comfortable with uncertainty, and A/B tests make this reality extremely apparent. Handling uncertainty wisely and using statistical tools like A/B tests well can give us the ability to make better decisions. Des and her team have used extensive testing to make Stack Overflow Jobs a great tool for developers in the market for a new opportunity, so be sure to check it out!